Mathematical Software. Mathematical Research. Mathematical Education. Tvalx Products.
What is a function. The strict definition of functions is given in the Set Theory. In this article we mean by function some correspondence between argument x and value y. This correspondence is expressed symbolically as y = f(x), where f denotes some way, usually formula, of mapping x onto corresponding y. So x and y have different roles. First we take x , then for that x we find exactly one corresponding y. But it is allowed that two different x's are mapped onto one y. X is taken from given set called domain of function. The set of y's is called range of function. Here we always work with functions with domain and range which are subsets of real line (set of real numbers). Such functions are called real functions. Here we identify the set of real numbers and the visual representation of real line as a line drawn on paper or blackboard, although such things are not the same. Such visualization is very useful for developing our intuition and understanding mathematical facts. For example, it is useful to draw graphs for understanding functions. But there are some difficulties. First is that the real line is infinite, where as the drawn graph is finite. Second, a function can have infinitely "fine" behavior, for example, oscillate near a point with infinitely diminishing step. Since an ideal graph is "infinitely thin" and a graph drawn on blackboard has some width, we cannot visualize such behavior in exact way, but just to hint. The next problem is visualization of graphs with help of computers. On the one hand, computers are suitable for drawing graphs, since they are capable of fast calculations. On the other hand, a computer monitor consists of pixels, which are discrete things. Even drawing a circle on monitor is impossible. If you look closely at a circle drawn on your monitor, you will see that the circle is build of short straight lines. Nevertheless, computer visualization of a function is very useful for developing mathematical intuition. Let's explore some functions using Math Center Level 1 and Math Center Level2.
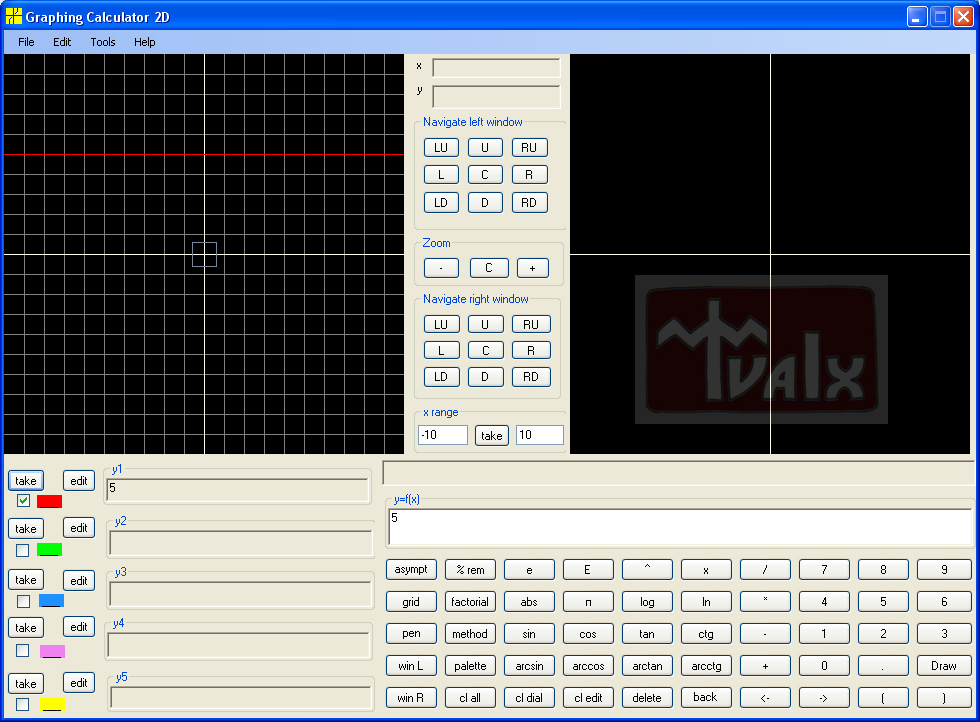
The simplest graph is probably a horizontal strait line given by formula f(x)=5, for example:
We easily guess that the domain of y = 5 is the entire real line ( not just interval from -5 to 5) and the range consists of one point 5.
The next function is y = x :
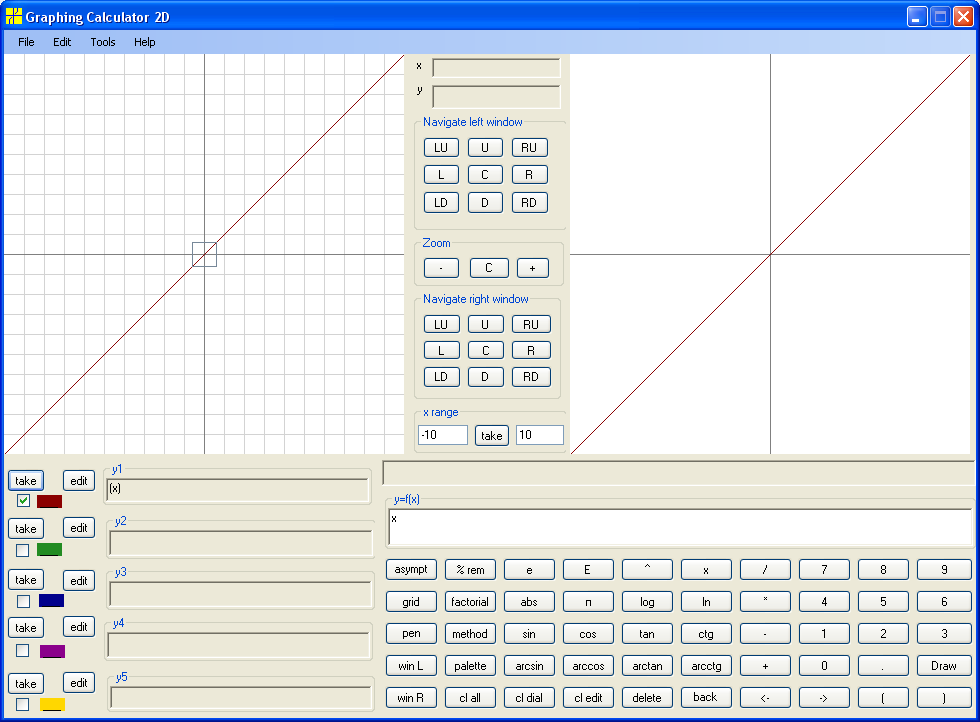
The domain of y = x is the entire real line and the range is also entire real line. This function has such "nice" feature as one-to-one correspondence, that is in addition to usual "for each x from domain there is exactly one corresponding y" we have "for each y there is exactly one corresponding x".
Now let's take y = x²:

From the graph it is not obvious that the domain is entire real line. So, here we have to apply logical reasoning and conclude that we can calculate x² for any positive and negative x. Since x squared is positive as for positive x as for negative x and zero squared is zero, we conclude that the range is set of all nonnegative real numbers. Those facts can be illustrated (not checked, since logical reasoning is primary source) by navigating the graph up and down.
Consider y = x³ :
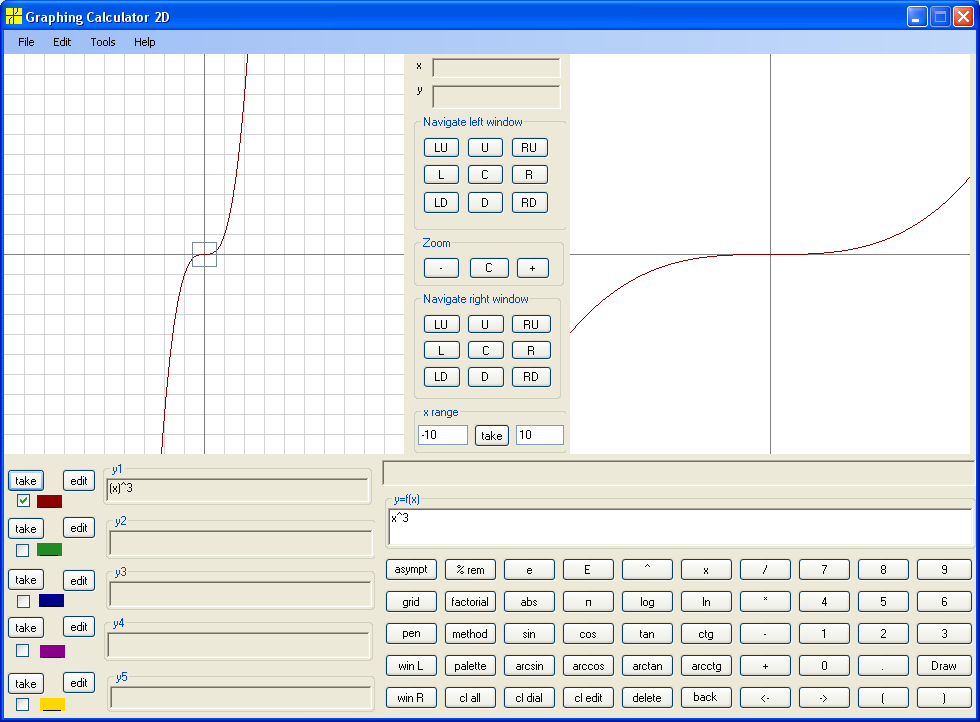
The domain is entire real line and the range is entire real line.
The graphs of y = x4, y=x6, y=x8, y=x10 are almost the same as for y=x2, but more "squared" "bottom" and with steeper "sides":
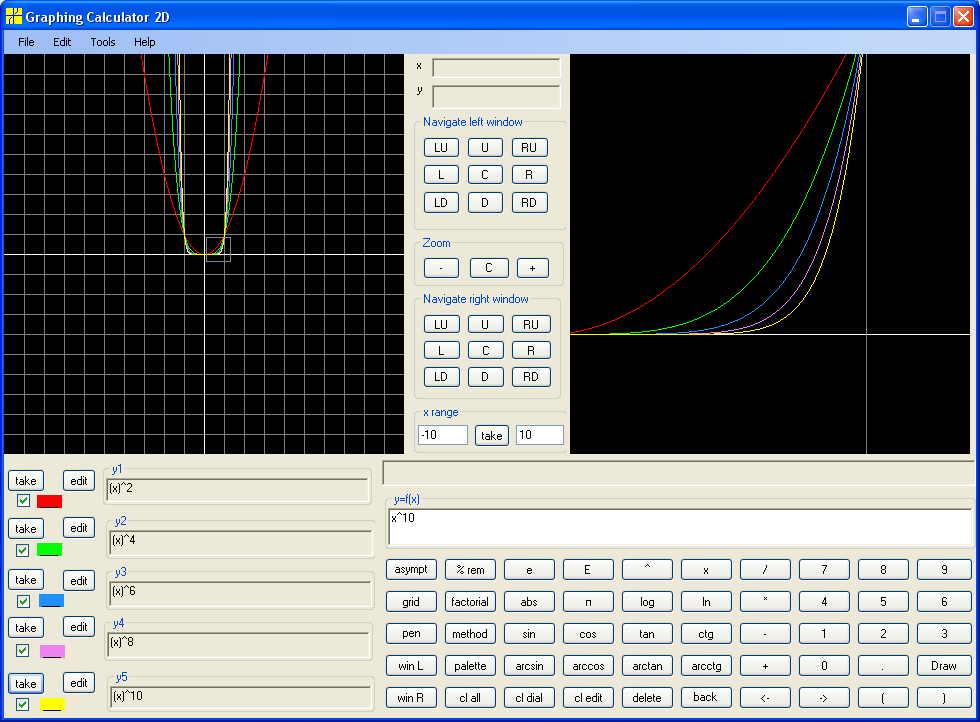
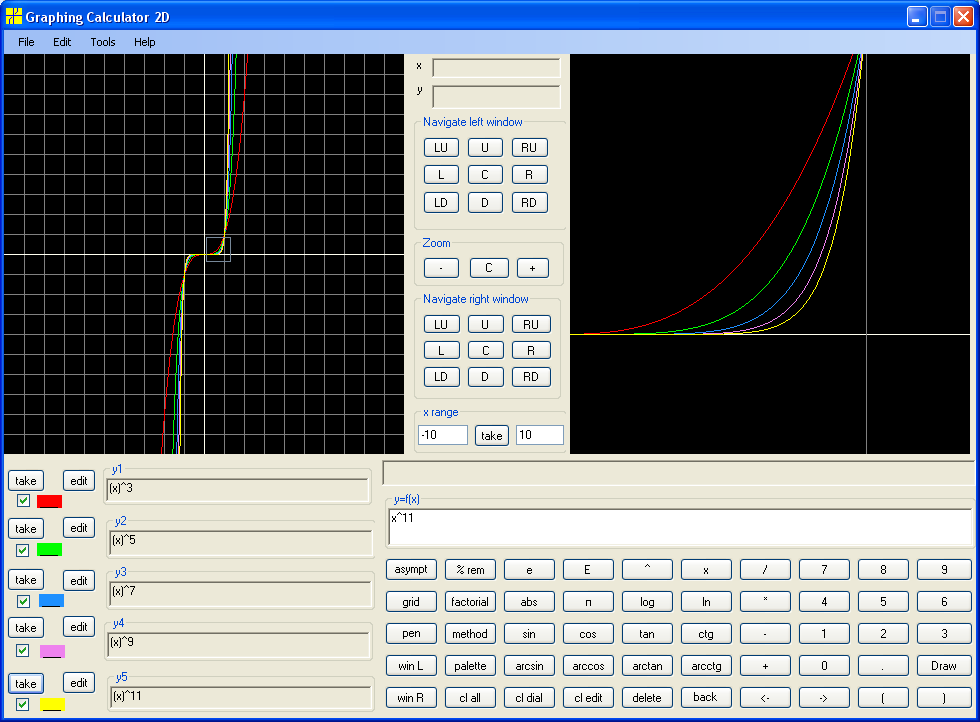
Similarly for y=x5, y=x7, y=x9, y=x11:
© 2008 Tvalx
