Mathematical Software. Mathematical Research. Mathematical Education. Tvalx Products.
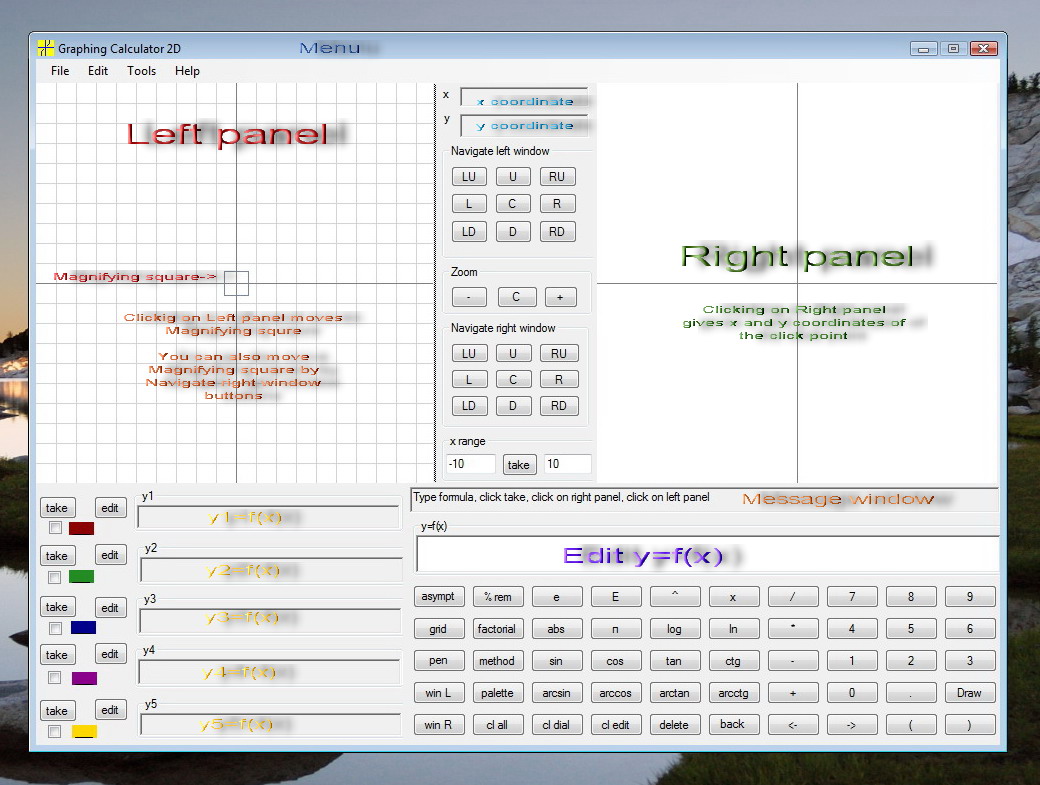
The Graphics Calculator 2D is a powerful graphing calculator for general purpose.
There are four standard arithmetic operations buttons : + - * / . Arithmetic operations have lowest priority.
Use (x)^(1/2) for square root. Button "ln" represents natural logarithm, that is logarithm with base e. Button "log" represents decimal logarithm, that is logarithm with base 10.
Graphing Calculator 2D supports all trigonometric functions: sin, cos, tan, ctg, arcsin, arccos, arctan, arctcg. In the Edit window arcsin, arccos, arctan, and arcctg are represented as asin, cos, atan, actg correspondently .
Button "abs" represents absolute value function. For example, if x=-5 then abs(x)=5.
Button "%" represents remainder function. For example, if x = 2.4 then x % 1 = 0.4. If x = 5 then x % 2 = 1 . If x=7.8 then (x -x %1) = 7 .
Button "factorial" represents factorial, which is treated as a function. If argument is less than 2, then value is 1. Otherwise factorial(x) = floor(x)! , where floor(x) is integer less than x.
Button "asympt" switches showing of asymptotes. All function which are represented on graphing panel as vertical lines are considered as asymptotes, even if they are not so . For example y = 500 * x will give vertical line and therefore will be treated as asymptote .
Button "grid" switches showing of grid on Left and Right panels .
Button "pen" switches size of pen between 1 and 2. If you want a pen of size greater than 2, then go to Menu, Tool, Customize, Pen Size .
Button "method" switches between manner of drawing graph: either dots or lines. Drawing by dots gives more realistic pictures for functions with "condensation" points, where graph oscillates with increasing frequency.
Button "palette" switches between two palettes: one is "black", the other is "white". The Black Palette looks good on monitor but is not appropriate for printing. Use for printing White Palette .
Button "win L" opens Left Window this Left Graph. The size of Left Graph depends on zoom of Left Panel. In the Left Window you see either the whole Left Graph (if zoom is small) or part of it (if zoom is big). In later case you can press button on mouse. Then cursor becomes a Hand Cursor. Holding button down drag the mouse and release the mouse button. The Graph will be dragged along with the cursor. The menu of Left Window has Print and Print Preview options.
Button "win R" opens Right Window with Right Graph. The zoom does not affect the Right Graph. Even not zoomed it is huge. Apply to it the same dragging technique. The menu of Right Window has Print and Print Preview options.
The Left Panel shows graphs scaled to range of x given in two "x range" windows. You can change the x range by typing new left and right values of x and by clicking the button "take" between the values. Xs should be integers and the minimal required difference between them is 2 (right x - left x >= 2) .
The Left Panel has the Magnifying Square represented by small square with gray border on the Left Panel. It is 16 times smaller than the Left Panel. The Right Panel shows content of the Magnifying Square magnified 16 times. You can press button "zoom +". Then the Left and Right Panels will be zoomed twice each. Maximum zoom is 8 (tree clicks of "zoom +"). After that you can click "zoom -". Clicking button "C" (for Center) on Zoom returns picture to starting position with no zoom and Magnifying Square at the center of Left Panel. When Panels are zoomed you can move Left Panel in horizontal direction along with imaginary zoomed graph by group of buttons "Navigate left window". Anytime you can move Left Panel in vertical direction. A group of buttons "Navigate right window" represents buttons by which you can move the Magnifying Square on the Left Panel. Button "C" returns Magnifying Square to the center of Left Panel. For fast movement of Magnifying Square click on the Left Panel at point where you want to place Magnifying Square. Clicking inside Right Panel gives x and y coordinates of click point. The greater is zoom, the more precise are the coordinates.
© 2008 Tvalx
![]()