Mathematical Software. Mathematical Research. Mathematical Education. Tvalx Products.
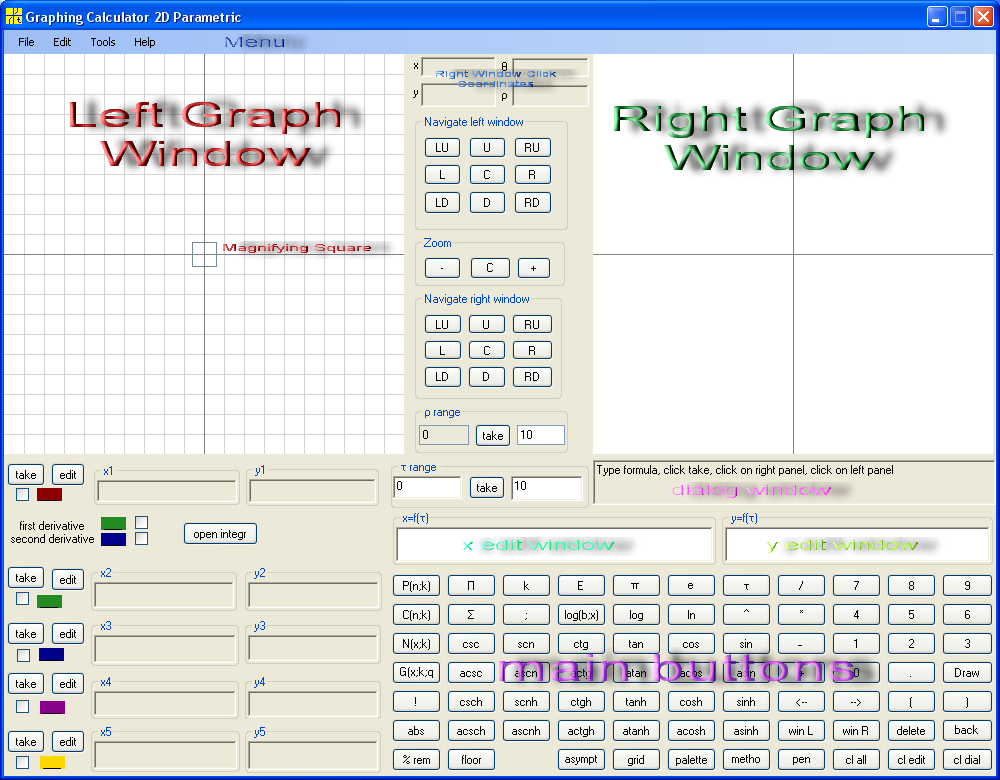
The Graphing Calculator 2D Parametric is a generalization of Graphing Calculator 2D Numeric. Now x and y are functions on parameter τ. If you are typing a formula using a keyboard, then you can use "tau" for τ . Since all calculations are done twice, for x and y, there was some sacrificing of precision in order to keep the speed of calculations. So, although it is possible to build the same graph of y=f(x) in parametric calculator using x=τ, y=f(τ), the Graphing Calculator 2D Numeric will build it with greater precision.
Ρ range corresponds to the scale of the Left Window. By default ρ range is equal to 10. It means that the origin in the Left window has 10 units to the right, 10 units to the left, and correspondently 10 units up and down. The ρ range does not correlate with τ range. It is your responsibility what part of the coordinate plane you want to see. The curve may be long or short, be near origin or far from it. If you draw multiple graphs then the picture is even more complicated. You always can navigate left window in any direction. Contrary to Graphing Calculator 2D and Graphing Calculator 2D Numeric there is no restriction of navigation to the chosen range of x. But if you open Left Window (by button win L) or Right Window (by button win R) in a separate window, your view will be restricted by the ρ range.
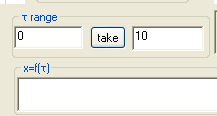
By default τ range is from 0 to 10. This is convenient since you can think of tau as time. But you can change tau range in any combination. For example from 10 to -10. It would process reverse in time. You can change the τ range using corresponding controls.
© 2008 Tvalx
